 Web Server Statistics for cumart.org Web Server Statistics for cumart.org
(Go To: Top: General Summary: Daily Summary: Hourly Summary: Domain Report: Organization Report: Operating System Report: Status Code Report: File Size Report: File Type Report: Directory Report: Request Report)
This report contains overall statistics.
Successful requests: 1,705
Average successful requests per day: 1,723
Successful requests for pages: 1,537
Average successful requests for pages per day: 1,553
Failed requests: 106
Redirected requests: 1
Distinct files requested: 284
Distinct hosts served: 126
Data transferred: 779.83 megabytes
Average data transferred per day: 788.59 megabytes
(Go To: Top: General Summary: Daily Summary: Hourly Summary: Domain Report: Organization Report: Operating System Report: Status Code Report: File Size Report: File Type Report: Directory Report: Request Report)
This report lists the total activity for each day of the week, summed over all the weeks in the report.
Each unit ( ) represents 40 requests
for pages or part thereof.
) represents 40 requests
for pages or part thereof.
day: #reqs: #pages: ---: -----: ------: Sun: 0: 0: Mon: 0: 0: Tue: 0: 0: Wed: 1702: 1534:
(Go To: Top: General Summary: Daily Summary: Hourly Summary: Domain Report: Organization Report: Operating System Report: Status Code Report: File Size Report: File Type Report: Directory Report: Request Report)
This report lists the total activity for each hour of the day, summed over all the days in the report.
Each unit () represents 5 requests
for pages or part thereof.
hour: #reqs: #pages: ----: -----: ------: 0: 30: 26:1: 41: 39:
2: 45: 43:
16: 136: 130:
(Go To: Top: General Summary: Daily Summary: Hourly Summary: Domain Report: Organization Report: Operating System Report: Status Code Report: File Size Report: File Type Report: Directory Report: Request Report)
This report lists the countries of the computers which requested files.
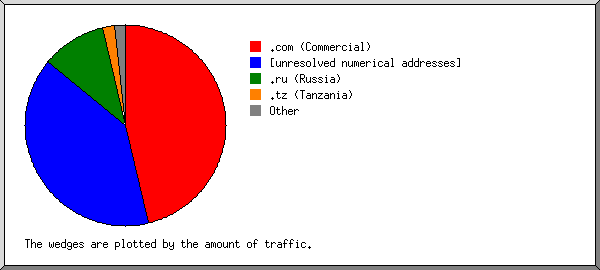
Listing domains, sorted by the amount of traffic.
#reqs: %bytes: domain
-----: ------: ------
 1098: 81.58%: [unresolved numerical addresses]
  385: 18.42%: .com (Commercial)
    1:       : .org (Non Profit Making Organizations)
    1:       : .sh (Saint Helena)
  170:       : .ws (Samoa)
   50:       : .net (Networks)
(Go To: Top: General Summary: Daily Summary: Hourly Summary: Domain Report: Organization Report: Operating System Report: Status Code Report: File Size Report: File Type Report: Directory Report: Request Report)
This report lists the organizations of the computers which requested files.
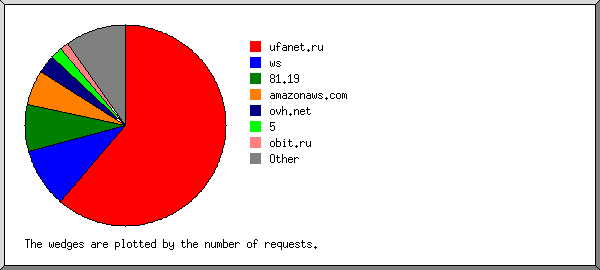
Listing the top 20 organizations by the number of requests, sorted by the number of requests.
#reqs: %bytes: organization
-----: ------: ------------
  964: 80.50%: 37
  213:  0.74%: amazonaws.com
  170:       : ws
  111: 14.96%: yandex.com
   50:       : ovh.net
   47:  0.38%: 81.19
   22:  1.65%: semrush.com
   21:  0.01%: 43
   20:  0.01%: 1
   16:  0.01%: 178.46
   11:  0.83%: mj12bot.com
    8:  0.17%: 5
    7:  0.23%: 185.192
    7:  0.06%: google.com
    6:  0.01%: livejournal.com
    5:       : 91
    4:  0.12%: 95
    4:  0.05%: apple.com
    3:  0.03%: wowrack.com
    3:  0.01%: googlebot.com
   13:  0.25%: [not listed: 10 organizations]
(Go To: Top: General Summary: Daily Summary: Hourly Summary: Domain Report: Organization Report: Operating System Report: Status Code Report: File Size Report: File Type Report: Directory Report: Request Report)
This report lists the operating systems used by visitors.
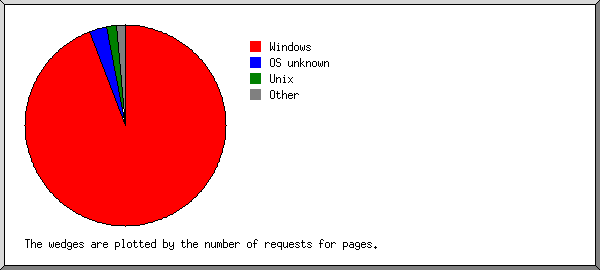
Listing operating systems, sorted by the number of requests for pages.
 #: #reqs: #pages: OS
--: -----: ------: --
 1:  1252:   1216: Windows
  :  1118:   1095:   Windows NT
  :   127:    121:   Unknown Windows
  :     7:      0:   Windows XP
 2:   194:    169: Known robots
 3:   228:    146: OS unknown
 4:    16:      5: Macintosh
 5:    15:      1: Unix
  :    15:      1:   Linux
(Go To: Top: General Summary: Daily Summary: Hourly Summary: Domain Report: Organization Report: Operating System Report: Status Code Report: File Size Report: File Type Report: Directory Report: Request Report)
This report lists the HTTP status codes of all requests.
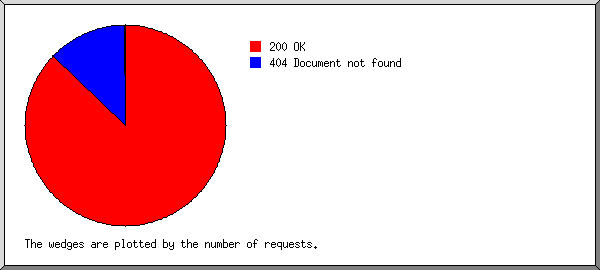
Listing status codes, sorted numerically.
#reqs: status code
-----: -----------
 1535: 200 OK
    1: 301 Document moved permanently
  170: 304 Not modified since last retrieval
  106: 404 Document not found
(Go To: Top: General Summary: Daily Summary: Hourly Summary: Domain Report: Organization Report: Operating System Report: Status Code Report: File Size Report: File Type Report: Directory Report: Request Report)
This report lists the sizes of files.
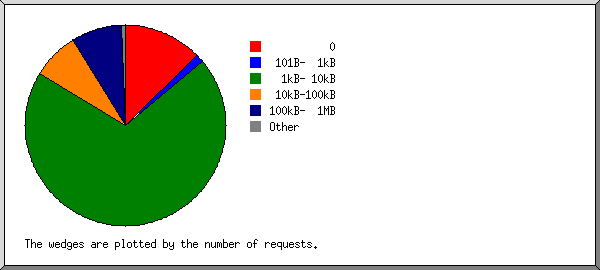
       size: #reqs: %bytes:
-----------: -----: ------:
          0:   390:       :
   1B-  10B:     0:       :
  11B- 100B:     1:       :
 101B-  1kB:    19:       :
  1kB- 10kB:   132:  0.08%:
 10kB-100kB:    88:  0.54%:
100kB-  1MB:  1058: 86.83%:
  1MB- 10MB:    17: 12.56%:
(Go To: Top: General Summary: Daily Summary: Hourly Summary: Domain Report: Organization Report: Operating System Report: Status Code Report: File Size Report: File Type Report: Directory Report: Request Report)
This report lists the extensions of files.
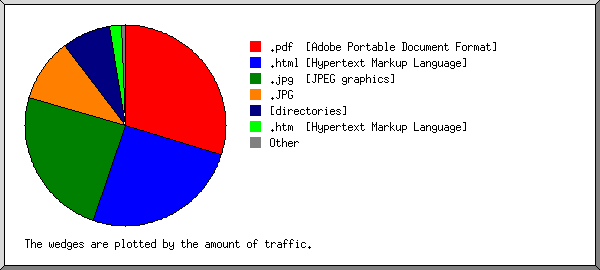
Listing extensions with at least 0.1% of the traffic, sorted by the amount of traffic.
#reqs: %bytes: extension
-----: ------: ---------
 1132: 86.26%: .html [Hypertext Markup Language]
   21: 12.62%: .mp3  [MP3 sound files]
   88:  0.64%: .jpg  [JPEG graphics]
    8:  0.20%: .swf
  115:  0.19%: .htm  [Hypertext Markup Language]
  341:  0.10%: [not listed: 11 extensions]
(Go To: Top: General Summary: Daily Summary: Hourly Summary: Domain Report: Organization Report: Operating System Report: Status Code Report: File Size Report: File Type Report: Directory Report: Request Report)
This report lists the directories from which files were requested. (The figures for each directory include all of its subdirectories.)
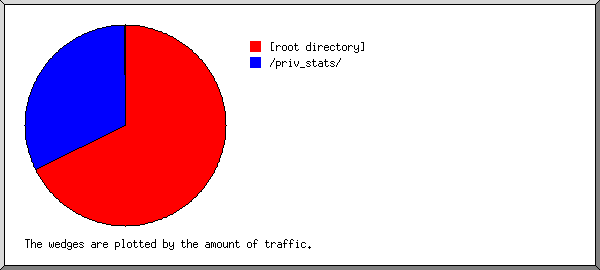
Listing directories with at least 0.01% of the traffic, sorted by the amount of traffic.
#reqs: %bytes: directory
-----: ------: ---------
 1128: 85.87%: /priv_stats/
  514:  8.52%: [root directory]
    9:  5.38%: /samarkand/
   32:  0.12%: /bh/
   11:  0.10%: /vtorushin/
   11:  0.01%: [not listed: 3 directories]
(Go To: Top: General Summary: Daily Summary: Hourly Summary: Domain Report: Organization Report: Operating System Report: Status Code Report: File Size Report: File Type Report: Directory Report: Request Report)
This report lists the files on the site.
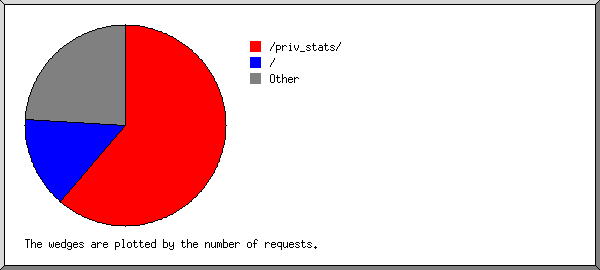
Listing files with at least 20 requests, sorted by the number of requests.
#reqs: %bytes:          last time: file
-----: ------: ------------------: ----
  964: 80.50%: May/ 9/24 12:00 AM: /priv_stats/usage_202403.html
  277:  0.03%: May/ 8/24 10:03 PM: /
  464: 19.47%: May/ 8/24 11:55 PM: [not listed: 252 files]
(Go To: Top: General Summary: Daily Summary: Hourly Summary: Domain Report: Organization Report: Operating System Report: Status Code Report: File Size Report: File Type Report: Directory Report: Request Report)


